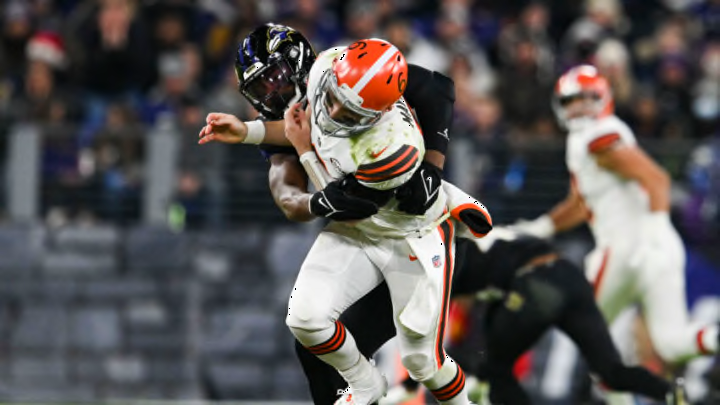
Snap count analysis shows the Ravens loaded up versus the run and dared Cleveland Browns QB Baker Mayfield to beat them. Didn’t happen.
If you are of the mindset that Baker Mayfield is pretty much performing as he normally does for the Cleveland Browns, you’re just going to get upset, so you may want to skip this article and move onto the next one.
The numbers show that the Ravens, who were the third-worst team in the NFL in terms of defensive passing yards per play, completely sold out on the run, and took pass defenders off the field in order to add more run-stoppers to slow down Nick Chubb and Kareem Hunt. It worked.
To see this, a comparison is shown of the percentage of snaps for each Baltimore player on defense by position, versus Cleveland and Chicago; i.e., their last two games.
In the game just prior to Cleveland, Baltimore faced Chicago with Justin Fields and Andy Dalton, who are not quite at Hall of Fame Level. Baker Mayfield is supposed to be better than both of those players.
The raw data are contained in page two of this article. But to summarize, here are the key differences:
Versus, Chicago, the Ravens used a nose tackle only 47% of the time. Versus the Browns, they used a nose tackle 92% of the time.
The Ravens had an average of 0.9 defensive tackles on the field for the Bears. For Cleveland, they upped that number to 1.35. That’s a 50% difference.
Versus Chicago, the Ravens had an average of 3.54 linebackers on the field. Versus the Browns, they decreased that number to 2.68. They also reduced the number of safeties slightly, from 2.35 to 2.28, and the number of corners was reduced from 2.54 to 2.37.
So in other words, you could say that they added down linemen and subtracted linebackers and defensive backs.
Additional discussion follows on page three. Basically, what the numbers are saying is that Baltimore wanted to do battle against Cleveland with big linemen. They didn’t add strong side linebackers or strong safeties to cover the extra tight ends for the Browns.
