Yards Per Reception
"Sony Michel: 9.9 Y/R Rashaad Penny: 9.3 Y/R Kerryon Johnson: 8.6 Y/R Boston Scott: 8.5 Y/R Saquon Barkley: 8.2 Y/R Nick Chubb & Trenton Cannon: 8 Y/R Ronald Jones & Justin Jackson: 7.7 Y/R Chase Edmonds & Nyheim Hines: 7.2 Y/R"
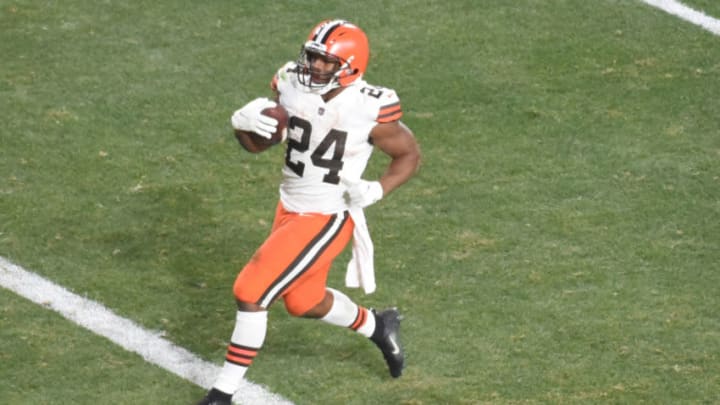
We arrive at our first statistic where Nick Chubb is not number one. Chubb is not known as a dominant receiving back, so he isn’t going to be at the top of these receiving-based statistics. Yards per reception is one of those statistics that can be skewed by a small sample size, but the receiving yards per game statistic will correct for this.
Michel and Penny, the two first-round pick running backs that are usually thought of as busts, take the one and two spots on this list. Neither average over a reception a game, which definitely should be an asterisk mentioned here.
To compare to Chubb, and Barkley, Chubb averages 1.6 receptions a game, and Saquon is really the outlier among this group, as he averages 4.8 receptions per game.
When he is healthy, the New York Giants really base their entire offense around Saquon Barkley, giving him the ball as much as possible. It’s interesting to think about if Barkley was in a position like Nick Chubb, where he got to get more rest time and take care of his body better, he might have more efficient stats, therefore giving him more production.
