Catch Percentage
"Royce Freeman: 83.1% Justin Jackson: 79.6% Jordan Wilkins: 79.5% Nyheim Hines: 79.1% Boston Scott: 79% Chase Edmonds: 76.6% Ito Smith: 76.4% Kerryon Johnson: 76.3% Nick Chubb: 75% Rashaad Penny: 73.9%"
Pro Bowl Appearances
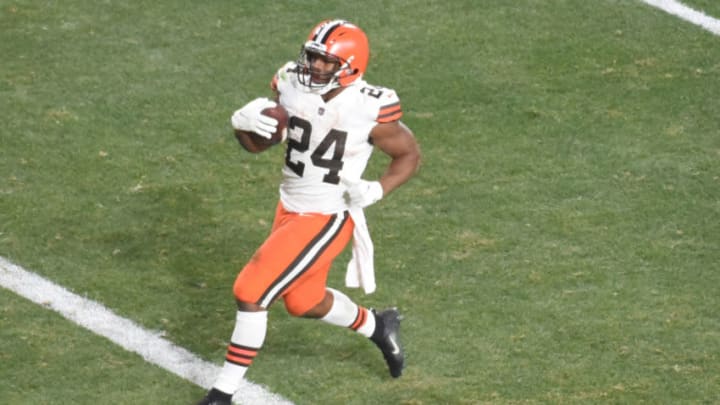
"Nick Chubb: 2 Saquon Barkley: 1 Everyone Else: 0"
For our last two statistics, we take a look at catch percentage and Pro Bowl appearances. Catch percentages are an interesting statistic as it takes into account how many targets a player actually ends up catching. Royce Freeman, for example, has caught 83.1% of the targets thrown his way in the NFL.
While catch percentage isn’t a prominent statistic when comparing running backs, and certainly shouldn’t be one that changes people’s minds about players, it is interesting to see how efficient they really are with the workload that is given to them.
As you can see, the catch percentage statistic is dominated by day three draft picks, which is a testament to those guys taking advantage of the opportunities they are given, and the small workloads a few of them have had in the NFL.
Then, of course, we have to compare the Pro Bowl accolades. These don’t really mean all that much, as Pro Bowls aren’t the best indicator to see who is the best players in the league. I wanted to point them out, though, to show how much separation there is in this draft class between the top tier of running backs and everyone else.
